Monday, August, 18th, 2014
by GEORGE BOLLENBACHER
Everyone is aware of the many and momentous changes in swaps regulation across the globe, and most of us have read predictions by various authorities (who may or may not have an axe to grind) on how the market will change as a result of regulations. However, there is precious little actual statistical evidence of how the market is changing, partly because the trade reporting regime worldwide is so broken.
Fortunately, the Bank for International Settlements publishes a couple of studies on market volumes, one showing outstandings and another showing trading volume. If we poke through their statistics, we can begin to see what’s really happening in the swaps market, but just begin.
Interest Rate Swaps
Because IRS is the largest sector of the market, it is best to start here. Let’s begin with trading volume, which the BIS samples triennially. What is particularly useful is the table that shows volume by party type. In the excerpt below, “financial” covers non-dealer banks, asset managers, insurance companies, central banks and, unfortunately, clearing houses.[1] Here are the figures, in billions, for 2007, 2010, and 2013. Note that the April, 2013 daily trading volume is just under $2.5 trillion, equating to about $560 trillion per year.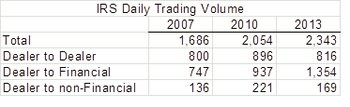 The first thing we see is that under all the new regulations the trading
volume actually increased, by almost 40% from ’07 to ’13. The second thing
is that D2D hardly increased at all, while D2F almost doubled. What that
tells us, I think, is that dealers are getting better at laying off their customer
positions with other customers, as opposed to using the interdealer market.
The first thing we see is that under all the new regulations the trading
volume actually increased, by almost 40% from ’07 to ’13. The second thing
is that D2D hardly increased at all, while D2F almost doubled. What that
tells us, I think, is that dealers are getting better at laying off their customer
positions with other customers, as opposed to using the interdealer market.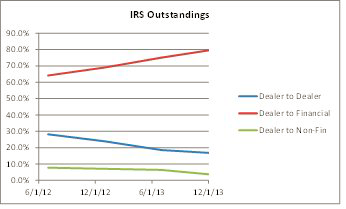 One caveat – some dealers were reporting cleared trades as done with
non-financials before 2013, and corrected their reporting to done with
financials by year-end. Thus some of the drop-off in D2N/F was due to data
corrections, not changes in transaction trends. However, with less than 5%
of the outstandings in the D2N/F category when correctly reported, the
portion of the market represented by “end-users” as defined by the CFTC’s
rules (non-financial corporations) represents a small and shrinking factor, in
both trading and outstandings, while financial counterparties (including
CCPs) represent a growing portion, in both measurements.
Suffice it to say that any argument that interest rate swaps, at least, are
essential for risk management by non-financials doesn’t really hold up under
this examination. On the other hand, the product appears very important for
the management of risk by financial users. And that accentuates a point I
made earlier on this site about the coming storm in this market.
One caveat – some dealers were reporting cleared trades as done with
non-financials before 2013, and corrected their reporting to done with
financials by year-end. Thus some of the drop-off in D2N/F was due to data
corrections, not changes in transaction trends. However, with less than 5%
of the outstandings in the D2N/F category when correctly reported, the
portion of the market represented by “end-users” as defined by the CFTC’s
rules (non-financial corporations) represents a small and shrinking factor, in
both trading and outstandings, while financial counterparties (including
CCPs) represent a growing portion, in both measurements.
Suffice it to say that any argument that interest rate swaps, at least, are
essential for risk management by non-financials doesn’t really hold up under
this examination. On the other hand, the product appears very important for
the management of risk by financial users. And that accentuates a point I
made earlier on this site about the coming storm in this market.
Credit Default Swaps
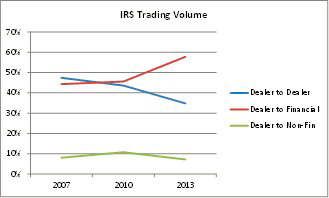
In this market sector, the BIS does not compile the turnover statistics that it does for IRS. So we have to look exclusively at the outstandings, for the same party types as IRS, but only available for 2013. The numbers are:Here’s that last factor in graph form, showing the percent of volume.
 When we turn to the outstanding IRS volumes, we see that the BIS
collects this data semi-annually, as opposed to triennially. This gives us a
much more granular view, but over a shorter period. Here are the same
party classifications for 2012 and 2013.
When we turn to the outstanding IRS volumes, we see that the BIS
collects this data semi-annually, as opposed to triennially. This gives us a
much more granular view, but over a shorter period. Here are the same
party classifications for 2012 and 2013.
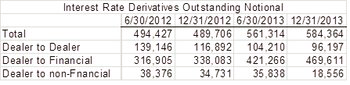 The first thing to note is that the 2013 trading volume of about $560 trillion
resulted in an increase of about $94 trillion in outstandings. In other words,
about 83% of the trading volume did not result in a new outstanding, which
speaks to the efficency of compressions and terminations.
The second thing to note is that the BIS double-counts both the trades and
outstandings in cleared trades, which inflates the outstandings in the D2F
category and makes it hard to figure out how financial customers are using
the products. On the other side of that factor is the much more efficient
compression of cleared trades, which serves to wring out of that number
most of the true back-to-back trades in the cleared space.
The third thing to note is that the trends between party types that we saw in
the trading volumes are echoed in the outstandings. The D2D and D2N/F
outstandings shrank significantly (by about 30% and 50% respectively)
while the D2F volume rose by about 50%. Here is the graphic
representation of the percentages of the market.
The first thing to note is that the 2013 trading volume of about $560 trillion
resulted in an increase of about $94 trillion in outstandings. In other words,
about 83% of the trading volume did not result in a new outstanding, which
speaks to the efficency of compressions and terminations.
The second thing to note is that the BIS double-counts both the trades and
outstandings in cleared trades, which inflates the outstandings in the D2F
category and makes it hard to figure out how financial customers are using
the products. On the other side of that factor is the much more efficient
compression of cleared trades, which serves to wring out of that number
most of the true back-to-back trades in the cleared space.
The third thing to note is that the trends between party types that we saw in
the trading volumes are echoed in the outstandings. The D2D and D2N/F
outstandings shrank significantly (by about 30% and 50% respectively)
while the D2F volume rose by about 50%. Here is the graphic
representation of the percentages of the market.
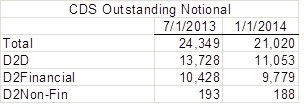 Here we see a 14% shrinkage in the outstandings, led by a 20% shrinkage
in D2D positions. And here the usage by non-financials is even lower than
IRS, which is indicative that corporates are not large lenders, and thus have
less need of credit protection. The D2F portion is a lower percentage than it
is for IRS, and the D2D is higher, probably reflecting the lower percentage
of CDS that are cleared.
Here we see a 14% shrinkage in the outstandings, led by a 20% shrinkage
in D2D positions. And here the usage by non-financials is even lower than
IRS, which is indicative that corporates are not large lenders, and thus have
less need of credit protection. The D2F portion is a lower percentage than it
is for IRS, and the D2D is higher, probably reflecting the lower percentage
of CDS that are cleared.
When we turn to the outstanding IRS volumes, we see that the BIS
collects this data semi-annually, as opposed to triennially. This gives us a
much more granular view, but over a shorter period. Here are the same
party classifications for 2012 and 2013.
The first thing to note is that the 2013 trading volume of about $560 trillion
resulted in an increase of about $94 trillion in outstandings. In other words,
about 83% of the trading volume did not result in a new outstanding, which
speaks to the efficency of compressions and terminations.
The second thing to note is that the BIS double-counts both the trades and
outstandings in cleared trades, which inflates the outstandings in the D2F
category and makes it hard to figure out how financial customers are using
the products. On the other side of that factor is the much more efficient
compression of cleared trades, which serves to wring out of that number
most of the true back-to-back trades in the cleared space.
The third thing to note is that the trends between party types that we saw in
the trading volumes are echoed in the outstandings. The D2D and D2N/F
outstandings shrank significantly (by about 30% and 50% respectively)
while the D2F volume rose by about 50%. Here is the graphic
representation of the percentages of the market.
Here we see a 14% shrinkage in the outstandings, led by a 20% shrinkage
in D2D positions. And here the usage by non-financials is even lower than
IRS, which is indicative that corporates are not large lenders, and thus have
less need of credit protection. The D2F portion is a lower percentage than it
is for IRS, and the D2D is higher, probably reflecting the lower percentage
of CDS that are cleared.
Some Conclusions
1. The imposition of rules as a result of Dodd-Frank, EMIR, and other regulations, has not caused a shrinkage in trading volume. A 40% increase in trading since the levels before the financial panic speaks to the overall demand for these products. 2. The growth in IRS outstandings during 2013 (about $94 trillion) is about 17% of the trading volume of about $560 trillion. Clearly, the growth of both clearing and bilateral compression, along with the natural run-off, has served to keep outstandings somewhat in check while trading volume has grown. And that’s a good thing. 3. The inclusion of CCPs with financial customers is an unfortunate choice on the part of the BIS. CCPs have a different role from all the other market participants, and including their volumes for both trades and outstandings makes analyzing the data much more difficult, if not impossible. 4. In these two markets, the volumes with non-financials, both trading and outstandings, are low and falling. However financial user volume is very large and rising, in spite of the more efficient compression of cleared trades. For these products, the management of financial risk, or its acceptance, is an enormous driver. Which means that there is a lot of financial risk out there, and much of it is housed at the CCPs. 5. D2D volume has been shrinking, in both trading and outstandings, ever since the financial panic, as dealers become more efficient at executing customer trades and collapsing offsetting positions. 6. If the fundamental changes outlined here are happening, the market needs more visibility into this data. Only when the reporting system begins to work properly will we have confidence in what we think we are seeing.[1] The inclusion of clearing houses in with financial customers obfuscates
both the trade and position data considerably. Hopefully, the BIS will modify
its categorization in the future by putting CCPs in a different category, so
that we can get a true measure of usage by financial customers.